CHAPTER 16
THE MAP WAS NEVER EMPTY
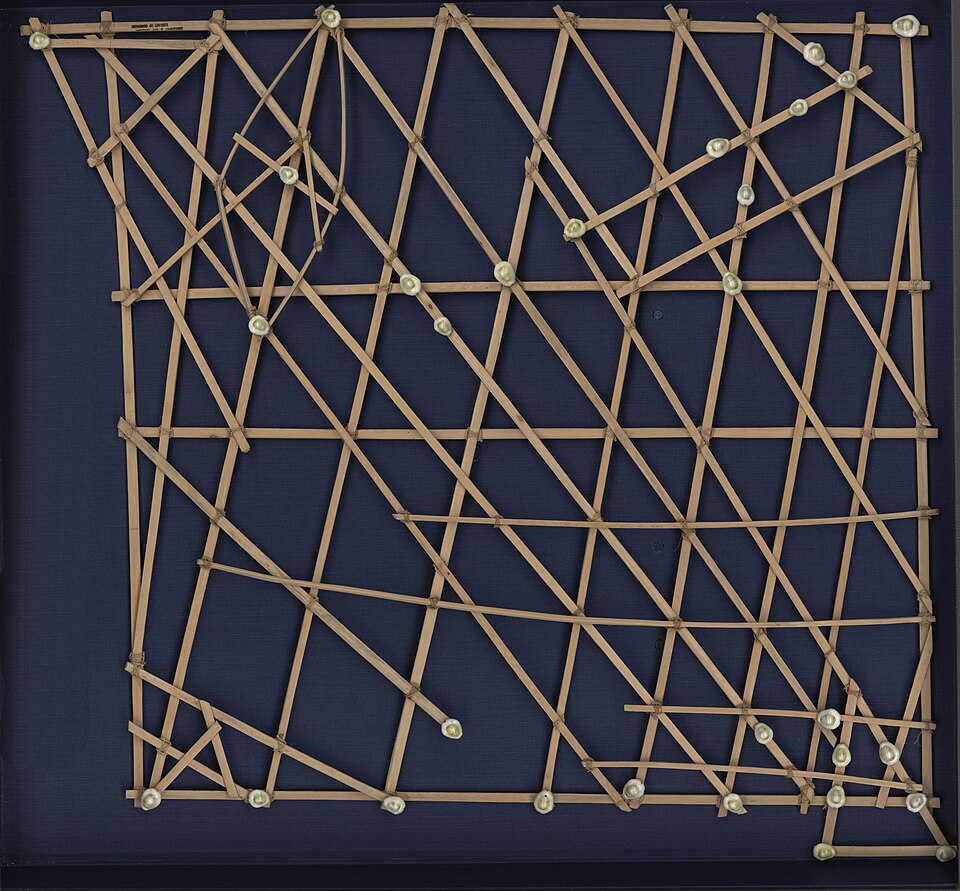
Figure 16.1. Marshall Islands stick chart, Rebbelib type, 1920s. The sticks and shells encode islands, wave patterns, swells and navigational relationships, demonstrating a cartographic tradition built around ocean knowledge rather than a European coordinate grid. Library of Congress, Geography and Map Division. Free to use and reuse.
Long before anyone in Aotearoa worried about coordinate systems, datums or EPSG codes, people were mapping the world around them. They did not always make maps in forms that a modern GIS professional would immediately recognise. There were no obligatory north arrows, neatlines, projection notes or scale bars, and in many cases there was no sheet of paper at all.
Geographic knowledge could be held in stories, place names, whakapapa, tracks, stars, winds, currents, reefs, mountains, food-gathering places and relationships between people and land. A map might be carried in memory rather than in a case, learned through repeated travel, recited or taught from one generation to the next. It could tell someone not only where a place was, but why it mattered, who was connected to it, what resources were found there, when they could be gathered and what had happened there generations before.
This presents a problem for any history of cartography that treats mapping as a steady progression from crude sketches towards increasingly accurate scientific maps. Told that way, the familiar characters arrive in an orderly sequence: Ptolemy, Mercator, astronomical navigation, Cook, triangulation, the surveyor, the national mapping agency and eventually the satellite. Indigenous peoples tend to enter the story later, often as guides, informants or names recorded in somebody else’s notebook. Yet the geography was already known before the notebook appeared. In Aotearoa, Māori had named mountains, rivers, harbours, settlements, fishing grounds, tracks and countless other features over many generations. Te Ara describes this body of geographical knowledge as forming an extensive oral map of the landscape, expressed through narratives, whakapapa and place names. The absence of a European-style planimetric map did not mean the absence of geography.[1]
There is no single Indigenous way of mapping, and it would be a mistake to invent one. It is also unnecessary to force every form of geographic knowledge into the modern category of a map. Different peoples developed different systems for navigation, territorial knowledge, memory and spatial representation. Some used physical diagrams or carved objects; others relied more heavily on oral traditions, memorised routes, environmental signs, genealogies, place names or combinations of these. The point is not that one tradition was purer than scientific cartography, or that one should replace another. The question that matters for this book is what happens when one particular way of representing geography becomes the version that governments, courts, property systems, schools and eventually computers treat as authoritative.
Maps begin to acquire a different kind of power when institutions act on them. A map used to find a fishing ground or navigate between islands does not carry the same authority as a survey plan recognised by a court. A place name remembered in a community does not have the same institutional status as a name recorded in an official national gazetteer. A customary boundary negotiated through relationships between neighbouring groups does not operate in the same way as a cadastral line registered in a land-title system. The difference is not simply one of accuracy. It is a difference in what institutions are prepared to recognise and act upon.
The navigation traditions of the Pacific make this clear. The islands of Micronesia and Polynesia are separated by enormous stretches of ocean, and to a reader accustomed to a printed chart, navigation without one can seem improbable. Pacific navigators developed sophisticated systems based on stars, winds, currents, birds, cloud formations, ocean swells and the way islands altered patterns in the sea. In the Marshall Islands, the objects commonly grouped together as stick charts were not all doing the same job. A mattang is commonly described as a teaching model for swell behaviour, while a rebbelib represents a broader network of islands and navigational relationships.[2] Curved and straight strips could encode wave patterns and relationships, and shells could mark particular islands or atolls. These were not simply European charts made from different materials. Some were learned from before a voyage rather than consulted continuously at sea. The navigator studied the representation, then read the ocean itself.
Asking what projection such an object used, what its scale was or how closely its geometry matched measured positions can miss the purpose of the representation. A swell chart was not trying to reproduce the ocean as a miniature topographic surface. It was preserving information needed to understand movement across it. Modern cartography makes the same kind of selection all the time. A road map discards geology, family histories, underground utilities, bird migration and most buildings because those things are irrelevant to its immediate purpose. Every useful map throws information away. The revealing question is what it chooses to preserve.
Pacific navigation also exposes an assumption embedded in many conventional maps. Land tends to become the subject while water becomes the background. Political maps colour countries and leave the oceans comparatively empty. Cadastral maps divide land into parcels and usually treat water as boundary or obstacle. Nautical charts reverse that relationship and make the sea intensely detailed; weather maps make the atmosphere the subject; geological maps make rock visible. Each representation brings one part of geography forward and pushes others back. No map can show everything, and no useful map should try.
The same point appears in a very different physical form on the east coast of Greenland. In 1885, an Inuit hunter named Kunit made a small set of carved wooden representations of coast, offshore islands and a peninsula near Ammassalik. The surviving objects could be handled as tactile geographic representations rather than read as north-up sheets.[3] Their precise use should not be overgeneralised: a Greenland National Museum curator has described the known examples as storytelling or explanatory aids rather than practical navigation charts. Their significance here is narrow but powerful. A geographic representation does not have to be flat, visual or organised around latitude and longitude to preserve useful spatial relationships. Maps can encode movement, shape, relationships or phenomena, depending on what their makers need to know.
One of the most remarkable encounters between different systems of geographic knowledge occurred aboard James Cook’s Endeavour in 1769. Tupaia, a Ra‘iātean priest, political figure and highly skilled navigator, joined the expedition and became an important intermediary between Cook’s crew and the peoples they encountered. The chart associated with him has fascinated historians because it does not behave like a conventional European chart. Islands do not always appear where a reader trained in latitude and longitude expects them. Earlier interpretations could therefore treat it as a failed attempt to copy European cartography. More recent work by Lars Eckstein and Anja Schwarz argues that it is better understood as an act of translation between navigational and representational systems.[4] The chart emerged from a collaborative encounter between Tupaia and members of the Endeavour expedition, and its unusual structure shows the difficulty of fitting a large body of Pacific wayfinding knowledge into a European graphical form.
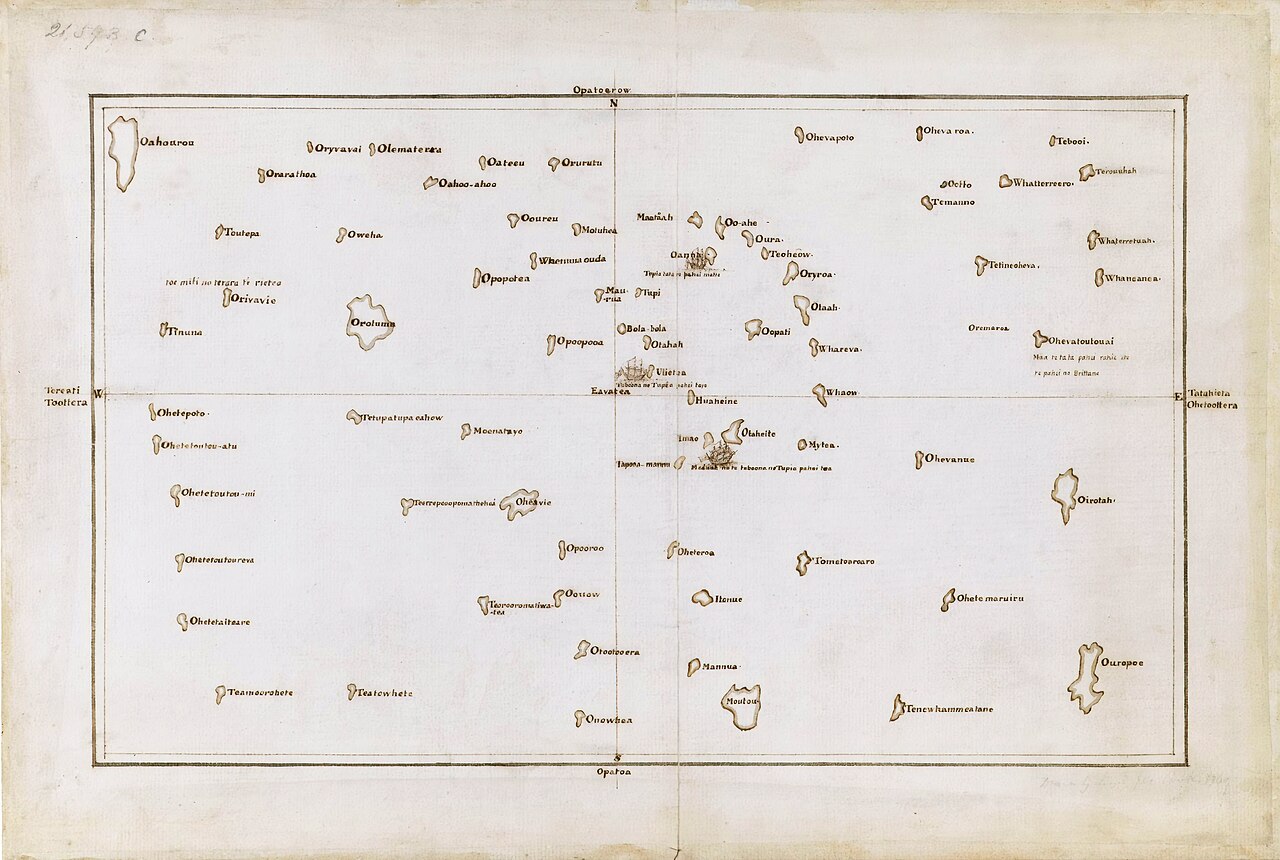
Figure 16.2. Tupaia's chart of Pacific islands, c.1769. The chart emerged from a difficult act of translation between Pacific wayfinding knowledge and a European graphical form, and should not be read simply as a failed latitude-and-longitude map. James Cook and Tupaia / British Library, Add MS 21593 C. Public domain.
Tupaia knew a vast geography of islands and relationships extending across thousands of kilometres of ocean. Cook’s officers had astronomical instruments, charts and a different mathematical tradition. Both could contain valid geographic knowledge while organising it in very different ways. Anyone who has worked with spatial data knows a faint modern echo of the problem: two datasets can describe the same place and appear irreconcilable when their reference rules differ. Tupaia’s chart is not a coordinate-reference-system problem, but it makes the broader point unusually vivid. Geographic knowledge and the graphical system used to represent it are not the same thing.
A still more direct example survives from Aotearoa. In 1793, Tuki Te Terenui Whare Pirau, usually called Tuki, and another Māori rangatira from northern New Zealand were forcibly taken to Norfolk Island.[5] Europeans hoped they could teach convicts how to process harakeke into flax fibre, but the scheme rested on a basic misunderstanding because preparing and using flax was largely women’s work. Accounts preserved by the National Library describe Tuki first drawing New Zealand in chalk on the floor of a room, after which the delineation was transferred to paper. A version based on the map appeared in David Collins’s 1798 history of New South Wales. It does not resemble Cook’s chart of the coastline. The far north, the part of the country Tuki knew best, is given striking prominence, while other regions are compressed. The map also carries social and spiritual geography, including a double-dotted pathway ending at Te Rēinga that represents the route taken by wairua towards the underworld.[6]
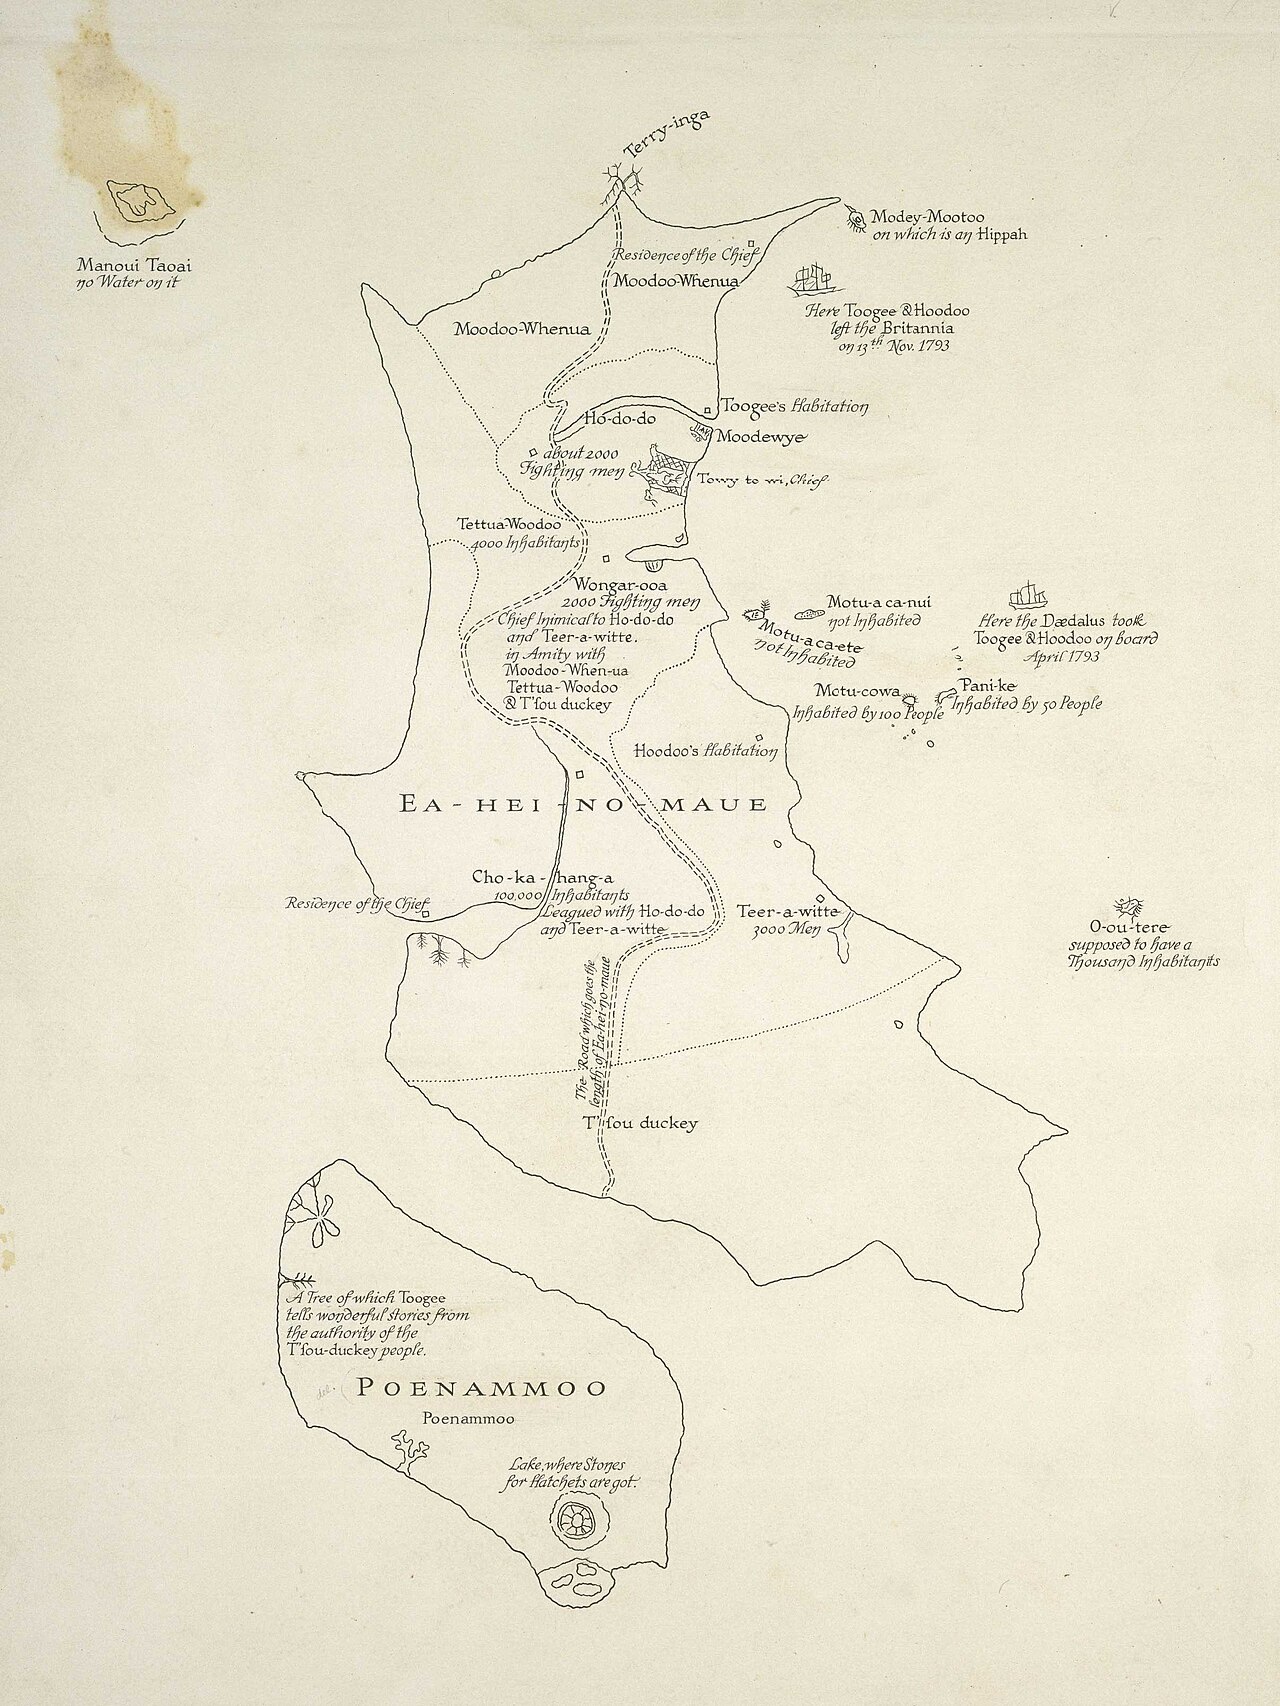
Figure 16.3. Map of New Zealand based on Tuki Te Terenui Whare Pirau's geographic knowledge, drawn in 1793 and published in 1798. Its emphases and its social and spiritual geography follow a different cartographic logic from a European coastal survey. Alexander Turnbull Library, MapColl-CHA-2/1/9-Acc.36440. Public domain.
Judged as a hydrographic survey, Tuki’s map is geometrically distorted. Judged according to what he was trying to communicate, that is not a sufficient description of it. Cartography always chooses which relationships deserve protection. Mercator preserves local angles and sacrifices area at high latitudes. Equal Earth preserves relative area and necessarily gives up other geometric properties. A schematic rail map moves stations and straightens routes because connectivity matters more than exact position. Tuki’s map followed another set of priorities. Its proportions reflected knowledge, importance and relationship rather than a uniform mathematical scale. The useful question is not whether every coastline is proportioned correctly, but what the map makes legible.
Chapter 6 showed how survey geometry acquired force through the Native Land Court, titles and state institutions. Here the important contrast is what that system displaced or subordinated: a landscape already structured by Māori names, whakapapa, occupation, cultivation, fisheries, routes and relationships. The difference was not knowledge versus an empty landscape. It was between forms of geographic evidence and the institutions empowered to recognise them.
Maps rarely exercise political power by themselves. Their power comes from the institutions that act upon them. A boundary in an atlas cannot stop anybody crossing it, but a state can enforce the boundary. A cadastral polygon cannot evict someone, but a legal system can recognise ownership based on it. A geographic name in a database cannot force people to forget another name, but the cumulative effect of schools, signs, legislation, search engines and official maps can make one name dominant and another increasingly difficult to find. Cartographic authority therefore sits not only in geometry but in the network of institutions that agree to treat the geometry, label or classification as consequential.
Naming deserves as much attention as surveying because a place name may preserve an ancestor, event, journey, environmental characteristic, resource or story. In that sense, a name can function as a compressed archive. When one name is replaced by another, the mountain, river or harbour remains physically unchanged, but information has been displaced. Colonial mapping across the world produced vast numbers of new names. Explorers and governments named places after monarchs, politicians, ships, patrons, military victories, distant towns and themselves. Sometimes existing Indigenous names survived, sometimes they were modified through spelling or pronunciation, and sometimes a new name became so dominant that later generations were unaware another had existed.
The contemporary process in Aotearoa shows that this authority can change. Ngā Pou Taunaha o Aotearoa, the New Zealand Geographic Board, operates within a framework in which te reo Māori names, consultation with iwi and hapū, and names restored through Treaty settlements form part of the official naming system.[7] The Board’s tangata whenua place-name maps incorporate names corrected or restored through research, Treaty settlement processes and direct consultation. Names that once existed outside the dominant official map can therefore move back into formal geographic systems. The physical place does not move when this happens. What changes is the authority surrounding its names. A name may begin as oral knowledge, appear imperfectly in a colonial record, survive in an archive, be recovered through research, receive official recognition, enter a national gazetteer and eventually appear in the databases used by digital maps.
The same movement from knowledge to archive and back into living geography can be seen in the history of Ngāi Tahu mapping. In 1880 Ngāi Tahu leader Hori Kerei Taiaroa gathered information from kaumātua about settlements, camps and mahinga kai across Canterbury and Otago.[8] The work was connected to longstanding efforts to document grievances arising from major South Island land purchases. More than a thousand place names were recorded, many relating to places where food and other resources had traditionally been gathered. Mahinga kai were not picturesque cultural annotations that could simply be added to a conventional land map. They were essential to movement, economy, food gathering and social relationships, so recording them preserved evidence of how Ngāi Tahu used and understood the landscape.
The resulting map did not disappear after the political circumstances that produced it had passed. Its information survived through archival records. More than a century later, the map and associated lists were used as evidence during the Ngāi Tahu Claim before the Waitangi Tribunal, and they subsequently became important sources for Kā Huru Manu, the Ngāi Tahu cultural mapping project. The sequence is remarkable because knowledge held by kaumātua became testimony, testimony became recorded place names, those names became a map, the map entered an archive, the archive later became evidence, and the historical evidence then became part of a contemporary digital geographic system. Cartography had not ceased to be powerful. The authority directing its use had changed.
This history complicates any simple claim that cartography belongs to one political side. The same technologies that can support colonial administration can later be used to document Indigenous rights and histories. Surveying mathematics can assist land acquisition or Treaty settlement. GIS software can support mining, conservation, emergency response, cultural mapping, military planning or Indigenous land management. A coordinate has no politics by itself. The institutions, purposes and relationships surrounding the coordinate are what give it political meaning.
The same tension appears in the global movement often described as counter-mapping. The term became influential through work such as Nancy Peluso’s 1995 study of forest territories in Kalimantan, Indonesian Borneo. State forestry maps classified land according to administrative and economic categories that could fail to recognise Indigenous occupation and customary territorial relationships. Communities and activists responded by producing maps of their own, using cartography to assert claims that had been poorly represented or omitted by official maps. A state had created a cartographic language through which territory was administered, and communities learned that language well enough to use it against the state’s own representation.
Similar approaches have since been used in many parts of the world to document tenure, support land claims, record cultural knowledge and manage natural resources. Techniques range from hand-drawn participatory maps to GPS field surveys, satellite imagery and sophisticated GIS databases. A major review by Mac Chapin, Zachary Lamb and Bill Threlkeld documented the rapid expansion of Indigenous mapping across regions and purposes.[9] The appeal is clear: information that is politically invisible can become visible in a form governments, courts and conservation agencies understand. Yet this is not a straightforward story in which the official map is bad, the community map is good and the problem is solved.
To become legible to governments or courts, communities may have to express territorial relationships in forms those institutions recognise. A flexible or seasonal relationship with land may become a polygon. A boundary understood through negotiation may become a fixed line. Overlapping interests may have to be simplified. A landscape understood relationally may acquire precise coordinates. A map can strengthen a political claim while altering the form of the claim itself, because once a boundary is drawn questions about who falls inside or outside it become difficult to avoid. Once a sacred place receives an exact coordinate, that coordinate can be copied. Once a community GIS exists, someone will ask whether its data should be made public, and once a spatial layer has been created it can be combined with other datasets for purposes its creators never intended.
These questions become especially difficult in the age of open data. GIS professionals have good reasons to value accessibility. Open government data can support research, reduce duplication, improve accountability and let communities examine public decisions. Interoperability and reuse are central to modern geospatial systems. Yet openness is not automatically ethical. In Aotearoa, Te Mana Raraunga has articulated Māori Data Sovereignty principles asserting Māori rights to govern Māori data and the systems through which it is collected, stored, interpreted, shared and reused. Internationally, the CARE Principles for Indigenous Data Governance emphasise Collective Benefit, Authority to Control, Responsibility and Ethics.[10] Both challenge the easy assumption that technically open and reusable data is necessarily socially appropriate.
For a GIS practitioner, this creates an uncomfortable but useful limit to technical thinking. A spatial database can be exemplary and still be wrong in ways no geometry validation will detect. Every polygon can close, every coordinate can be valid, the metadata can be complete, the server can conform to standards and the projection can be appropriate, while the project still violates the authority or expectations of the people whose knowledge it contains. There is no coordinate system for consent. Sometimes the responsible map is the one that reveals less.
This idea runs against a technological culture in which progress is often associated with greater precision, higher resolution and broader access. Satellite imagery becomes sharper, positioning becomes more accurate, databases become larger, storage becomes cheaper and governments release increasingly detailed information. The underlying assumption is that more geographic knowledge available to more people must represent progress. Frequently it does. Sometimes, however, responsible governance means deciding that certain information should not be made public at all. This does not represent a rejection of mapping. It recognises that maps operate within social relationships and that visibility itself can have consequences.
The history of cartography is frequently presented as a history of expanding visibility. Blank coastlines are filled in, longitude becomes measurable, triangulation spreads, aerial photography reveals landscapes from above, satellites observe the planet, GPS provides near-instantaneous position, LiDAR records surfaces in extraordinary detail and global databases accumulate billions of geographic features. The apparent direction of travel is from ignorance towards complete knowledge. Yet many supposedly blank spaces on historical European maps were blank only for the people drawing those maps. A forest described as unknown might have contained generations of local geographic knowledge. A coastline appearing for the first time on a European chart may have been named and navigated for centuries. A mountain described as discovered by an explorer may have been central to the identity and cosmology of people living beside it. To say that a place was unmapped often means only that it had not been mapped within a particular cartographic tradition.
Scientific cartography remains an extraordinary achievement. Cook’s charting of New Zealand’s coastline demanded remarkable observation and hydrographic skill; geodesy created global reference frameworks of extraordinary precision; surveying, mapping and geographic information science transformed what people can measure and build. The error comes only when one highly successful representation of the world is confused with the world itself.
Modern cartographic scholarship has spent decades examining this distinction. J. B. Harley and other scholars helped broaden the history of cartography beyond the idea of a sequence of increasingly accurate scientific documents. Maps could be examined as cultural objects produced by particular societies for particular purposes, without abandoning geometry or measurement. Somebody always decides what will be shown, what will be omitted, what will be named, which boundaries count and which categories will organise the result. That observation applies to a colonial survey plan and to a digital map in 2026 alike.
A software developer chooses a basemap. A government chooses an authoritative boundary dataset. A naming authority determines official names. A database designer creates the schema. A cartographer selects the projection. An algorithm determines which labels appear at which zoom levels. A product team decides which settings users will encounter by default. Most people viewing the finished map will never know that any of these decisions were made. This is one reason cartographic power can be harder to recognise today than it was during the age of colonial surveying. A nineteenth-century surveyor standing on disputed land with instruments and pegs is visibly engaged in territorial measurement. A default setting in software looks almost invisible, yet defaults can influence what hundreds of millions of people see.
A projection becomes normal because it is preselected. A disputed boundary becomes familiar because it arrives with the basemap. One name dominates another because a search engine lists it first. The modern exercise of cartographic power often works not by forcing people to use a particular map, but by ensuring that they rarely need to make an active choice. This brings the story back to contemporary Indigenous GIS. The important feature of a project such as Kā Huru Manu is not simply that Indigenous communities have adopted modern mapping software. Framing the story that way would make the technology the protagonist again. The more significant change concerns authority: decisions about what is mapped, how features are described, which stories accompany them, who governs the data and which information becomes public can remain with the people whose geography is being represented.
For much of colonial history, Indigenous knowledge entered maps controlled by others. A guide identified a route, a community supplied a name, an elder described a boundary, a surveyor recorded it, a cartographer determined how it appeared and a government archive stored the resulting document. Contemporary Indigenous mapping can reorganise that relationship. Communities can commission the work, determine categories, hold the database, define access rules, correct records and decide that some information will never appear in a public layer. The coordinates may use exactly the same national datum or global geodetic system as a government map, while the politics can nevertheless be entirely different.
Kā Huru Manu also demonstrates that the past does not need to be discarded to achieve this change. Historical surveys, archival documents, oral histories, traditional place names and modern spatial technologies can be combined. Colonial records can be interrogated rather than simply accepted. A document produced within one political system can become evidence within another. Taiaroa’s 1880 map is valuable partly because it translated knowledge into a documentary form that survived within institutions capable of preserving it. Colonial archives can therefore preserve evidence later used to challenge colonial decisions. Military maps become historical sources, property plans can reveal patterns of dispossession, old aerial photographs document environmental transformation, and survey plans may preserve Indigenous place names that disappeared from later maps. Maps are exceptionally good at surviving the political intentions of their makers.
For that reason, it is too simple to describe cartography merely as propaganda or an instrument of domination. Maps can serve power and expose it. They can erase information and preserve it. They can facilitate dispossession and help document claims for redress. They can simplify a landscape in damaging ways, or simplify it in precisely the way required to make an important relationship visible. A map can be meticulously accurate and still mislead, and it can be geometrically distorted while being entirely appropriate for the purpose for which it was created.
This book is centred on a change in projection, which makes projection an obvious place to look for politics. Indigenous mapping shows that many of the most consequential decisions occur much earlier. Before a projection is chosen, somebody has already decided what will be mapped. Before a line is rendered, somebody has decided that a boundary exists. Before a label is placed, somebody has chosen a name. Before a database is published, somebody has determined who is entitled to see it. Before a coordinate is transformed, someone has decided that the thing being represented can usefully be reduced to a coordinate in the first place.
EPSG:8857 answers a much narrower question. An equal-area projection can preserve relative area on a world map; it cannot resolve sovereignty, return land, restore language, judge the legitimacy of a boundary or govern sensitive knowledge. That matters, but it matters within a much larger history of deciding who represents geography and whose representation becomes authoritative. The geometry of a projection is objective enough to calculate precisely while the meaning attached to that geometry is social and historical. We can calculate how much Mercator enlarges a region at a given latitude, but we cannot calculate with the same precision what generations of seeing a particular world map have meant for public perceptions of geography.
Keeping those different kinds of claim apart makes the case for better cartography stronger. When the purpose of a map is to compare the relative sizes of countries and continents, preserving area matters. When the purpose is marine navigation, other properties may matter more. When the purpose is documenting an Indigenous relationship with land, a conventional cadastral polygon may be inadequate. When the purpose is protecting culturally sensitive information, not placing the information on a public map may be the most responsible cartographic decision. A good map begins with a clear understanding of what it is for.
Tuki knew what his map was for. Tupaia knew what his geographic knowledge was for. Marshallese navigators knew what swell patterns were for. The makers of the east Greenland carved coastlines knew which shape needed to be remembered by hand.[11] Colonial surveyors knew what land parcels were for. Hori Kerei Taiaroa knew why Ngāi Tahu place names and mahinga kai needed to be recorded. The point is not that all purposes are equivalent. It is that every map has one. Selection and abstraction are unavoidable, and somebody chooses what to include, how to classify it, what to call it and how to display it.
The modern GIS profession inherits this history along with an extraordinary amount of capability. A single analyst can now combine in an afternoon what once required entire government departments: cadastral parcels, census statistics, high-resolution satellite imagery, elevation models, property information, road networks, hydrology, ecological data and historical maps. A cloud service can publish the result worldwide almost immediately, while machine-learning systems can discover patterns across datasets too large for any human cartographer to inspect feature by feature. The technology has changed dramatically, but the underlying questions have not. Who supplied the data, who defined the categories, who benefits from the map, who is missing, who decided that a boundary exists, who selected the name, who is allowed access and who can correct an error?
Maps have power because they are useful to governments, communities, scientists, navigators, emergency services and Indigenous organisations. The task is to recognise where authority enters that usefulness. For several centuries, European scientific cartography expanded alongside European political and economic power. European states possessed ships, military forces, survey organisations, printing systems, bureaucracies and educational institutions capable of making their geographic representations authoritative far beyond Europe itself. Other forms of spatial knowledge did not cease to exist; they became easier for those institutions to ignore.
That relationship is changing. Indigenous peoples are producing and governing their own geographic databases, recovering traditional names, challenging official classifications, mapping cultural landscapes and determining when information should remain restricted. Historical maps are being read against the purposes for which they were created, archives are being combined with oral histories, and survey plans are being used as evidence. Cartography has not become less scientific through these developments. The range of people able to direct its scientific and institutional power has widened.
The map was never empty. The world did not wait to be discovered, named, surveyed or entered into a database before it became geography. European scientific cartography developed powerful techniques for representing that world, and colonial governments gave some representations extraordinary legal and institutional authority. The contemporary change is not rejection of those techniques but a widening of who can decide how they are used. At global scale, the same question returns: who decides what the world should look like, which properties a flat map should preserve, and which inherited defaults still deserve authority?