CHAPTER 14
WHERE THE DATABASE CUTS THE WORLD
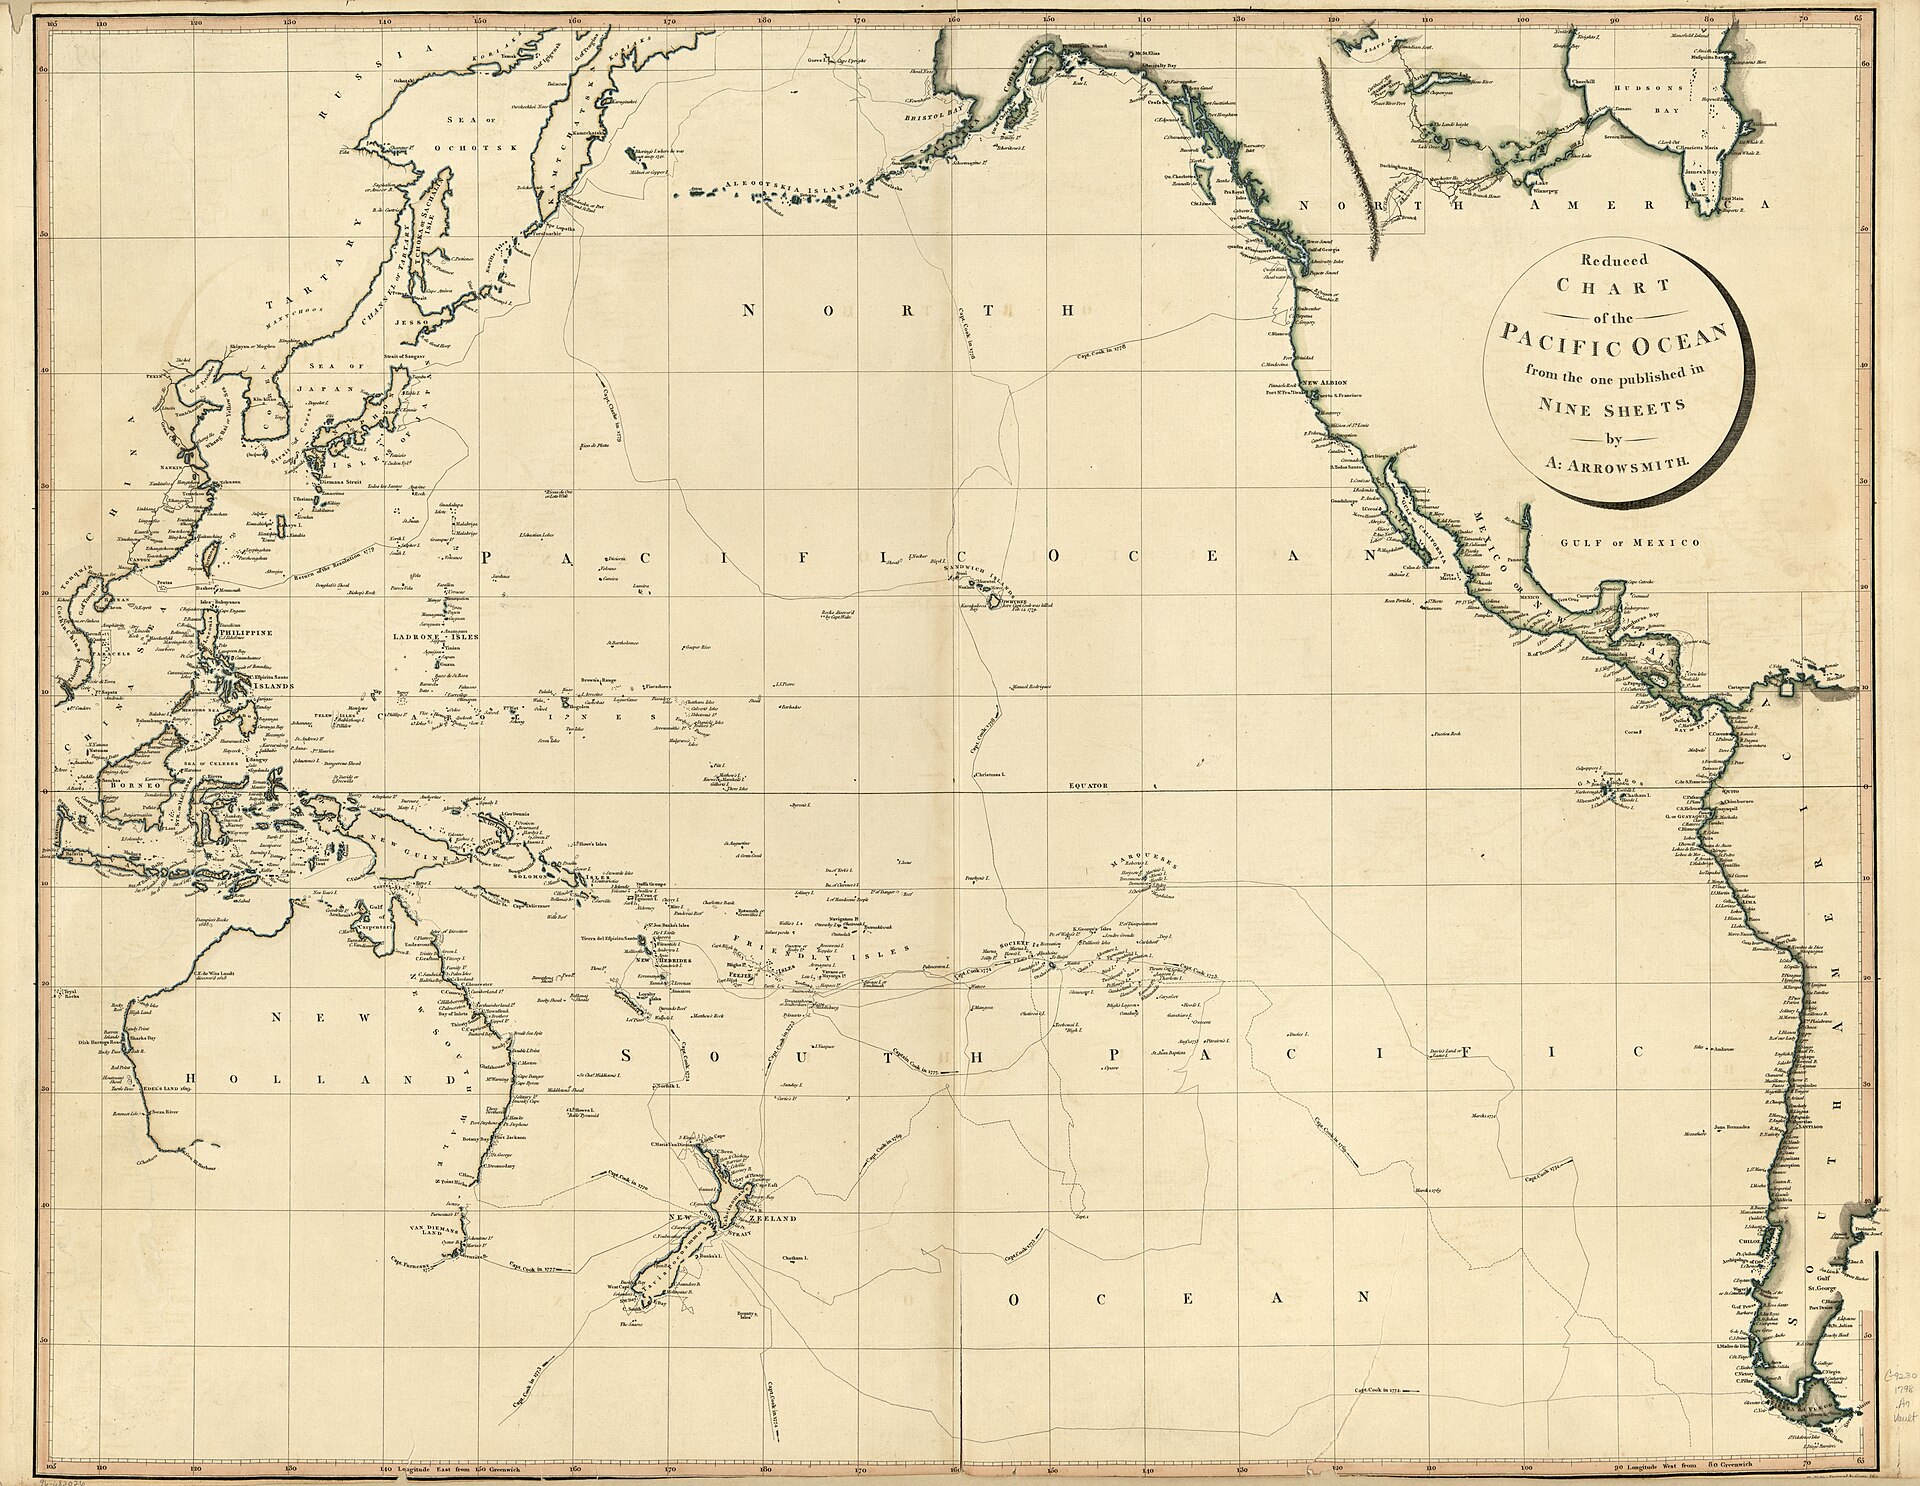
Figure 14.1. Aaron Arrowsmith's Reduced Chart of the Pacific Ocean, 1798. The Pacific is treated as a continuous geographic space, with Cook's routes crossing it, rather than as two fragments pushed against opposite edges of a database or world map. Library of Congress, Geography and Map Division. Free to use and reuse.
In August 2016, the authors of one of the internet’s most important geographic data standards needed an example of a place where ordinary map logic becomes strange. They chose Fiji.
The document was RFC 7946, the specification for GeoJSON. The format is intentionally simple. A point is a pair of numbers. A line is a list of points. A polygon is a ring of coordinates. A bounding box records the smallest rectangular extent containing a feature. The simplicity is one reason GeoJSON became so useful for moving geometry between databases, browsers and mapping applications.
Then the standard reaches the Pacific. Imagine points spread through the Fiji archipelago between roughly sixteen and twenty degrees south. Some lie just west of the 180-degree meridian. Others lie just east. On a globe they are neighbours. In the usual longitude convention, however, one group has coordinates near 177 degrees east and the other near 178 degrees west.
RFC 7946 gives the bounding box as a western edge of 177 and an eastern edge of minus 178.[1][2] Read geographically, that is a narrow box crossing the Pacific seam, only five degrees of longitude wide.
Read as an ordinary minimum-to-maximum range, it looks backwards.[3]
Reorder the values numerically from minus 178 to plus 177 and the box suddenly spans 355 degrees. Fiji has not expanded. The data structure has simply gone the long way around the Earth.
The antimeridian problem appears in four numbers, revealing something a smooth digital map is very good at hiding. When a continuous planet is stored as coordinates, the coordinate system has a join.
Longitude is circular. Most data structures are not.
Starting from Greenwich, longitudes increase eastward towards 180 and decrease westward towards minus 180. At the far side of the planet, 180 degrees east and 180 degrees west refer to the same meridian. On a globe, nothing dramatic happens there. The surface continues.
In an array of numbers, something dramatic happens. A value close to +180 can be followed by one close to -180 even though the two locations are a few kilometres apart.
A human sees neighbours. A naïve Cartesian algorithm sees a jump of almost 360 degrees.
Suppose a route runs from 170 degrees east to 170 degrees west. The intended route may cross only twenty degrees of longitude over the Pacific. If software connects the endpoint values as ordinary x-coordinates, it may draw a line across Asia, Europe, the Atlantic and the Americas before reaching the other point.
The endpoints are valid. The interpretation of the connection is wrong.
GeoJSON deals with this explicitly. For interoperability, RFC 7946 recommends cutting geometries that cross the antimeridian so that the resulting pieces do not cross it.[4] A line can become two segments, one ending at +180 and one beginning at -180. A polygon can become a MultiPolygon with matching edges on opposite sides of the coordinate seam.
The Earth has not been cut. The polygon has.
That is where cartography becomes data engineering. A paper mapmaker can draw a feature to the edge of the sheet and continue it on the other side. A database must decide exactly how the geometry is represented. That choice affects bounding boxes, spatial indexes, centroids, intersections, clipping, measurements and rendering.
For many developers in Europe or North America, this problem remains comfortably remote. A municipal road layer in Berlin or Boston can live its entire life without approaching 180 degrees longitude. Software can be written under the quiet assumption that the western coordinate will always be numerically smaller than the eastern coordinate, and the assumption may survive for years.
Fiji breaks it immediately, as do the Aleutians, parts of Russia and Alaska, Pacific shipping routes, cyclone tracks, satellite paths, maritime boundaries and global datasets that cannot politely stop at the edge of a conventional map.
The wider geography of New Zealand belongs to the same world. Mainland Aotearoa lies in east longitudes. The Chatham Islands lie beyond the 180-degree meridian in west-longitude notation. New Zealand’s maritime interests and Pacific relationships extend across the part of the coordinate system where the sign changes. A dataset that treats the region as a coherent whole therefore encounters the same problem as the GeoJSON example.
There are several ways to survive the seam. One is to split the geometry. GDAL, one of the foundational open-source libraries beneath modern GIS software, includes a `-wrapdateline` option in its ogr2ogr tool for exactly this purpose. Natural Earth, the widely used global map dataset, requires linework crossing 180 degrees to be clipped there and to resume with matching geometry on the opposite edge.
Another approach is to change the longitude convention. Instead of storing longitudes from -180 to +180, a system can use 0 to 360. A point written as 170 degrees west becomes 190 degrees east. A feature spanning 170 east to 190 east is then numerically continuous across the Pacific. PROJ supports this kind of wrapping, and global maritime datasets are sometimes distributed in explicit 0-to-360 variants for precisely this reason.[5]
The numerical convention has changed, not the locations.
This is the kind of problem GIS practitioners learn from symptoms. A modest island chain becomes a polygon covering most of the world. A route between neighbouring islands swings across continents. A spatial index says two nearby features are extremely far apart. A centroid turns up near Greenwich because coordinates on either side of the sign change were averaged as ordinary numbers.
The screenshot can be funny; the same error is less amusing when the geometry represents a cyclone warning, an exclusive economic zone, a cable route, a fisheries closure or a search-and-rescue area.
The Pacific is not unusually difficult geography. It is unusually inconvenient geography for a set of global conventions whose join happens to run through it.
That join is often confused with another famous Pacific line: the International Date Line.[6]
They are related, but they are not the same thing. The antimeridian is the meridian 180 degrees from Greenwich. It follows from the longitude framework. If Greenwich is zero, the opposite meridian is 180 degrees. Its mathematical location does not bend around islands or governments.
The International Date Line is a timekeeping convention. It runs broadly through the Pacific because changing calendar date near 180 degrees is convenient, but it bends around states and island groups. Governments can alter which side of the calendar divide they choose to occupy.


Samoa demonstrated the difference dramatically in 2011.
That year Samoa legislated a change to its standard time and moved, for Samoan civil purposes, from the eastern side of the International Date Line to the western side.[7] Thursday 29 December 2011 was followed by Saturday 31 December. Friday the 30th disappeared from Samoa’s civil calendar. The legislation had to deal with pay, deadlines and other ordinary consequences of removing a date. It also explicitly addressed maps, charts and atlases.
The law did not move longitude 180; it changed Samoa’s relationship to the calendar convention drawn near it.
Kiribati had already made a comparable move in the 1990s so that its widely scattered island groups could share the same calendar day. The resulting date-line convention reaches well east of the antimeridian.
Several different lines can occupy roughly the same part of a familiar world map while doing entirely different jobs: the antimeridian belongs to the longitude system, the International Date Line is a civil time convention, and a projected map’s seam depends on where the mapmaker chooses to cut the display.
A Greenwich-centred rectangular world map often places its seam near 180 degrees, which makes all three seem more closely connected than they are. Recentre the map on the Pacific and the visual seam can move into the Atlantic. Greenwich longitude has not changed. The antimeridian has not changed. Samoa’s legal time has not changed. Only the map’s frame has moved.
Digital mapping adds another twist to the distinction between reference and display: even if the display seam moves, the underlying data may still be stored in a coordinate range that jumps from +180 to -180.
A Pacific-centred map can therefore look continuous while its database still contains an antimeridian problem.
That is why experienced GIS developers become careful about words such as split, wrap, clip, normalise and repeat. They are not synonyms.
A Web Mercator map may repeat the world horizontally, so dragging east beyond 180 degrees simply reveals another copy of the tiled world. The display feels continuous. The feature geometry underneath may still be stored as a ring that crosses the sign change, as multiple parts split at the seam, or as coordinates expressed in another longitude range. A renderer, spatial database and tile generator may each have different rules for handling it.
When all the rules agree, the user notices nothing. That invisibility is the achievement.
The Fiji example is useful because it makes the whole problem visible without a border dispute, political campaign or exotic mathematics. A bounding box is enough. Four numbers that appear to be in the wrong order are correct once the reader remembers that longitude is circular.
The absurdity exists only after the planet has been mentally converted into a rectangle.
There is no edge of Earth at Fiji. There is no natural break at the Chathams. There is no gap between Russia and Alaska. The edge belongs to the representation.
Once the representation becomes infrastructure, however, the edge acquires practical consequences. Data formats describe it. Libraries add flags for it. Dataset publishers maintain alternate versions. GIS analysts test for it. Governments legislate nearby time conventions. The seam becomes real in the same sense that standards generally become real: systems must agree about what happens there.
Once the convention is embedded in formats and software, its consequences are measurable without requiring a larger theory about maps constructing reality.
For global data, the practical question is straightforward. When geometry approaches 180 degrees longitude, stop assuming the rectangle is ordinary. Check the bounding box. Check whether the software understands antimeridian-spanning geometry. Check whether the feature needs to be split or wrapped. Check the longitude convention. Check whether a calculation is planar or geodesic. And do not confuse a date-line map with the mathematical antimeridian.
The phone hides all of this extremely well. A user swipes across the Pacific and sees a continuous world. Longitudes wrap. Tiles repeat. Polygons split. Coordinates transform. The software spends considerable effort making the seam disappear.
Horizontal wrapping cannot hide Web Mercator’s other edge. Travel far enough north or south and the coordinate world simply stops, while the planet continues.