CHAPTER 13
THE JOKE CODE THAT ATE THE WEB
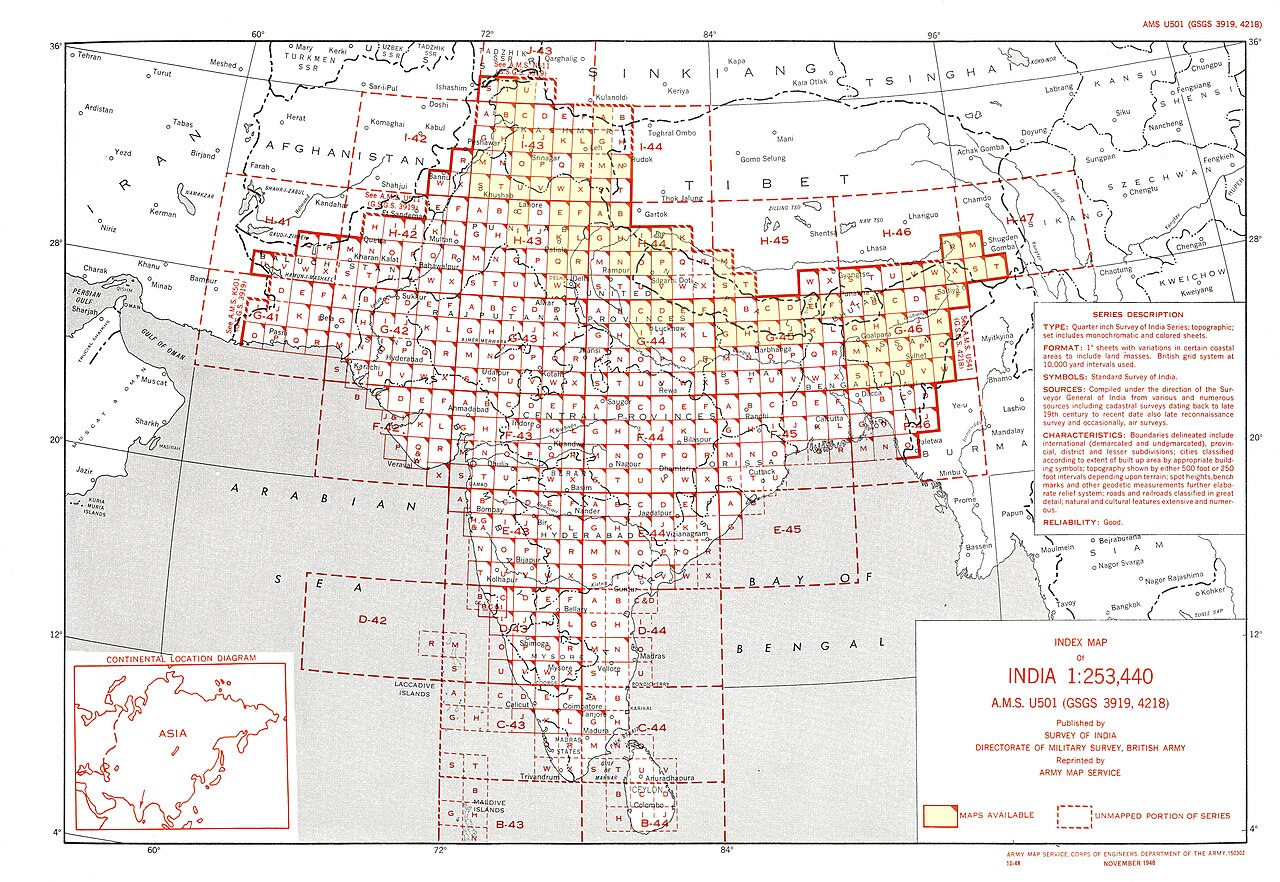
Figure 13.1. Survey of India sheet-index map, 1948. Long before global web-map tiles, large mapping systems were already divided into regular numbered sheets so users could retrieve a particular piece of a much larger geographic whole. Survey of India / Directorate of Military Survey. Public domain.
On the evening of 6 August 2007, Christopher Schmidt published a very short blog post about a very large problem.[1]
Schmidt was working with OpenLayers, the open-source web-mapping library. Google Maps had already changed what people expected a map on a computer screen to do. Instead of clicking an arrow, waiting for a new page, clicking again and waiting again, users could grab the map and drag it. Roads slid beneath the mouse. New imagery arrived around the edges. Zoom in and more detail appeared. Zoom out and the world reassembled itself.
Developers wanted other services to behave the same way. They wanted their own data to line up with Google-style maps, map servers to return the right pieces at the right scale, and software libraries to agree about where every coordinate belonged. For that, they needed a common name for the coordinate system underneath the new web map.
There was a difficulty. No tidy official EPSG identifier yet described exactly what these systems were using. Some existing Mercator definitions were close, but not quite the same. Close is a dangerous word in geodesy. A coordinate system can be close enough to draw something recognisable and wrong enough to make overlaid data drift apart.
OpenLayers therefore needed a label. Schmidt’s post proposed 900913, a deliberately unofficial piece of leetspeak for GOOGLE. It was memorable and immediately useful. A month later the number was in OpenLayers code.
The number did not create the projection. It revealed that the projection had become important enough to need a common language, which is the more interesting story.
Google Maps had launched in February 2005 with an interface that now feels ordinary and at the time felt startlingly fluid. A user could drag the map without forcing the whole page to reload. The illusion of continuity depended on a simple engineering idea: the browser did not receive one enormous image of the planet. It received only the rectangular pieces it needed.
Those pieces were tiles. At the broadest zoom, imagine the usable world reduced to one square tile.[2] Zoom in once and that square becomes four. Zoom again and it becomes sixteen. Each level doubles the number of tiles along each side. The browser asks only for the small set visible on screen, and those tiles can be cached, reused and served by different machines.
A planetary map had become a filing system.
The server no longer needed to think about the whole world whenever somebody looked at Wellington. It needed to know the zoom level and the x and y address of the required tile. The mathematics beneath that filing system had to behave in a predictable way from one side of the planet to the other.
The Mercator family was attractive because its local angular behaviour suited street-scale display, but Web Mercator is not the ellipsoidal conformal Mercator used in geodesy. EPSG:3857 applies spherical Mercator equations, using the WGS 84 semi-major axis, to WGS 84 geodetic latitude. That approximation simplifies the global tile mathematics but does not preserve conformality exactly on the ellipsoid. At ordinary street-map scales the difference is usually visually small. Technically, the modern name matters: WGS 84 / Pseudo-Mercator, EPSG:3857.[3]
Web Mercator is therefore not simply Gerardus Mercator’s 1569 map moved into a browser. It belongs to the same family and inherits the dramatic enlargement towards high latitudes, but it is a modern computational variant built around web visualisation.
It also has one feature computers adore: between about 85.051 degrees north and south, the projected world can be made square.[4]
A true Mercator projection never reaches the poles. The scale grows without bound as latitude approaches ninety degrees. For the web, the answer was practical rather than philosophical. Stop before infinity becomes a software problem. Clip the world at the latitude that makes the projected height equal its width, then divide the square again and again into tiles.
That square was a gift to the web. It could be halved cleanly. Each half could be halved again. Adjacent tiles could be found with simple arithmetic. Cache keys could be predictable. Browsers could request only what they needed. A user could pan apparently without end while the system quietly swapped rectangular pieces beneath the cursor.
The history of Web Mercator should therefore not begin with Greenland.[3]
Greenland’s exaggerated apparent area is real. So is the enlargement of Canada, Russia, Scandinavia and Antarctica as latitude rises. But those distortions do not explain why the projection became infrastructure. The decisive attraction was that the geometry suited the engineering of a fast, global, tiled, interactive map.


The projection protected what the application valued. At neighbourhood scale, users wanted roads to cross correctly, street geometry to look familiar and adjacent map tiles to meet cleanly. At world scale, the same system produced the area distortion already familiar from Mercator maps. The advantage and the sacrifice came from the same choice.
The next step was repetition.
Once a company has a global tile grid, it can cache the results. Once it has cached millions or billions of tiles, continuity becomes valuable. Once libraries understand that grid, data providers gain an incentive to use the same one. Once providers use it, more developers adopt compatible libraries. A different projection is no longer merely a different equation. It becomes an interoperability decision.
This is where 900913 becomes more than a joke.[5]
OpenLayers needed a label because software components had to talk to each other. A map service needed to know what spatial reference a request used. A Google-compatible layer and another service needed to meet in the same projected space. The number was an adapter between systems moving faster than formal standards.
Then the standards machinery caught up. EPSG introduced an official Popular Visualisation CRS / Mercator entry as EPSG:3785 in 2008.[6] That identifier was later deprecated, and EPSG:3857 became the formal code for WGS 84 / Pseudo-Mercator in 2009.
The genealogy is untidy. The result is simple. A de facto convention became formal infrastructure.
By the 2010s, this was no longer meaningfully a Google-only story. OpenStreetMap used the same broad slippy-map logic. Microsoft and other platforms used compatible approaches. GIS software supported it. OGC standardised the WebMercatorQuad tile matrix set. Apple developer documentation describes custom map tiles in EPSG:3857. Even the formal name GoogleMapsCompatible survived in standards language.
Compatibility had become a feature in its own right.
New Zealand’s national mapping agency provides a useful reality check. LINZ serves Web Mercator tiles because they plug easily into the global mapping ecosystem. It also serves NZTM2000 tiles in EPSG:2193 because New Zealand-focused mapping has different requirements. The same organisation uses both because the jobs differ.
The persistence of 3857 does not require a conspiracy. It requires accumulated usefulness.
There was no meeting at which the internet voted to make Mercator permanent. There was a sequence of practical decisions. Google built an unusually effective interactive map. Developers imitated and extended the approach. Open-source libraries needed compatible formulas and identifiers. Tile conventions spread. Standards bodies formalised common practice. Data providers valued interoperability. Users came to expect smooth panning, predictable zooming and familiar basemaps.
The system acquired weight.
That is path dependence in its least dramatic form. A decision that is cheap at the beginning can become expensive to reverse after enough other things depend on it. Railway gauges do this. File formats do it. Keyboard layouts do it. Spatial reference systems do it too.
The cost of changing Web Mercator is not mainly the cost of reprojecting coordinates. GIS software can do that routinely. The cost is systemic. Tile servers, caches, APIs, application code, vector and raster products, documentation, third-party services and user expectations may all assume a particular geometry.
Imagine a warehouse filled with millions of square pieces from one enormous jigsaw puzzle. Somebody proposes a better-shaped final picture. The new picture may be excellent, but the old pieces were cut for another frame. They cannot all be snapped into the new outline without some work.
That is what lock-in looks like in cartography.
Lock-in is not permanence. Modern digital mapping can support globes, alternate display projections and regional coordinate systems without requiring every underlying dataset to be stored in the display CRS. A printed sheet commits to one projection, while software can increasingly change representation with scale and task. That flexibility matters later in the book; here it is enough to note that Web Mercator’s installed infrastructure is substantial without being mathematically compulsory.
That is also why Web Mercator deserves a fair history. Its weaknesses at world scale are genuine. So are its achievements. It helped make interactive mapping cheap enough, fast enough and standardised enough to become ordinary infrastructure. Restaurants, buses, property listings, emergency dashboards, weather systems, hiking apps, delivery services and government portals could all build on a common spatial platform.
The web did not adopt 3857 because engineers wanted Greenland to dominate the planet. It adopted a geometry that solved a practical interface problem very well, then kept using it because compatibility accumulated around the solution.[7]
The joke code records the moment when that accumulation became visible.
In 2007 the formal registry had not quite caught up with practice, so a developer community invented a memorable name. Later the standards became sober, the software became enormous and 900913 survived as a fossil from an unusually informal stage in the construction of global infrastructure.
Gerardus Mercator received immortality through a surname; Google briefly received calculator text. The joke became serious because the map beneath it became serious.
The square tiled world created another problem. A square has edges. On screen, horizontal wrapping can make one edge almost disappear. In the underlying data, however, a feature crossing from 179 degrees east to 179 degrees west can still become spectacularly confused. At that seam sits Fiji.